IELTS Report 9- Line Graph- Temperature Changes in Algeria
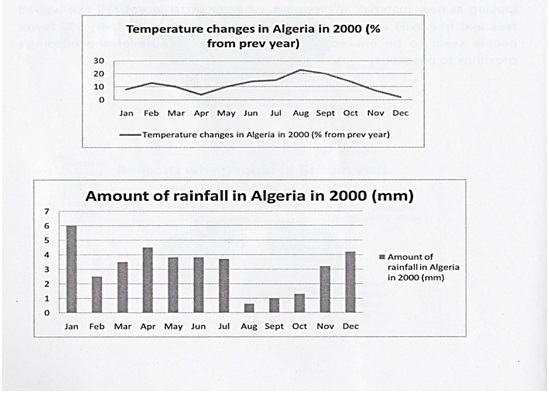
We were given a chart that included one line graph and one bar chart. The graph showed temperature changes in a one year period for an African city, having a peak in August. The bar chart showed the amount of rainfall over the same period, and monthly, in millimeters.
Summarize the information by selecting and reporting the main features, and make comparisons where relevant.


The charts compare the changes in temperature and the amount of precipitation in Algeria in the year 2000.
It is clear that Algeria saw the highest temperature during August, while December was the coldest month of the year 2000. In Algeria, the amount of rainfall was largest in January, whereas Algeria experienced the lowest humidity in August. Overall, the temperature in Algeria is in inverse proportion to the rainfall.
As can be seen from the charts, the largest amount of rain fell (6mm) in January 2000, and the temperature of the month increased to 8%. When the precipitation in Algeria decreased to about 2.5mm, in February the temperature rose to about 14%. By April, the temperature continued to drop to 5%, while the total rainfall stood at its second highest at about 4.5mm.
The temperature rose steadily April onward, and reached a peak of about 22% in August. However, the amount of precipitation decreased from April and dropped significantly to approximately 0.5mm by August. In December, Algeria saw the lowest temperature with only about one tenth percent increase. On the other hand, just over 4mm of rain fell in the same period.


