IELTS Report 12 – Pie Chart – Spending Habits of People in UK


The graphs show changes in spending habits of people in UK between 1971 and 2001.
Write a report to a university lecturer describing the data.


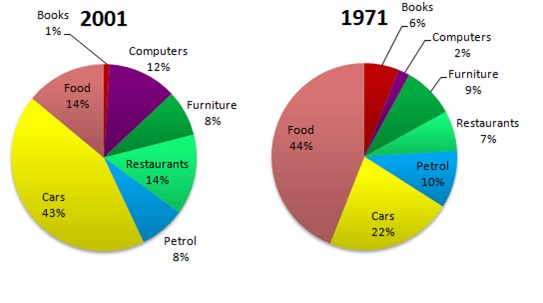
The pie charts compare the percentage of expenditure by the people in the UK on seven different categories; computers, books, furniture, restaurants, petrol, cars and food. Figures are given for the years 1971 and 2001.
In general, there were higher percentages of expenditure on food, furniture and petrol in 1971 than that in 2001. In contrast, the year 2001 had higher percentages of spending on cars, restaurants and computers.
In particular, the year 1971 mainly had large proportions of expenditure on food and cars. The percentage of spending on food was the highest, at 44%, while the proportion of expenditure on cars was less than a quarter, at 22%. In 1971, British people spent 10% on petrol, compared to 7% on restaurants. The figures for furniture, computers and books presented 9%, 2% and 6% respectively.
On the other hand, the year 2001 had higher expenditures on cars, food and restaurants. The percentage of spending on cars was less than a half, at 43%, while the figures for both food and restaurants take up 14% for each. The proportion of spending on computers made up 12%. The categories for petrol, furniture and books showed relatively lower proportions of expenditure which were 8%, 8% and 1% respectively.


I’m so happy to contact you
Awesome work