IELTS Report 2 – Bar Chart – Home and International Students


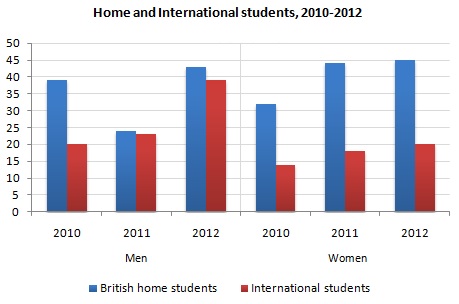
You should spend about 20 minutes on this task. The bar chart below gives information about the number of students studying Computer Science at a UK university between 2010 and 2012. Summarise the information by selecting and reporting the main features, and make comparisons where relevant.


The bar graph indicates the differences in the figure for students learning Computer Science at a Britain university for two years.
According to the data, the main trend was that the number of all kinds of pupils increased steadily with the exception of that of British home students.
In detail, regarding female students, there was a continuous climb in the number of the native students and foreign students during the two-year period. Moreover, while the number of the former ones kept the largest (32, 44, 45), the figure for the latter one remained the lowest (14, 18, 20). Following that, in regard to male students, there was a considerable rise in the number of international students from 20 to 39 over the period. On the contrary, albeit the number of the U.K. home students slumped over the first two years, it skyrocketed during the second two years and it reached 43 in 2012 which was slightly smaller than that of female native students.
To sum up, it is seen that the number of only British local students did not increase continuously.


