IELTS Report 17 – Line Graph- Outokumpu Share Price
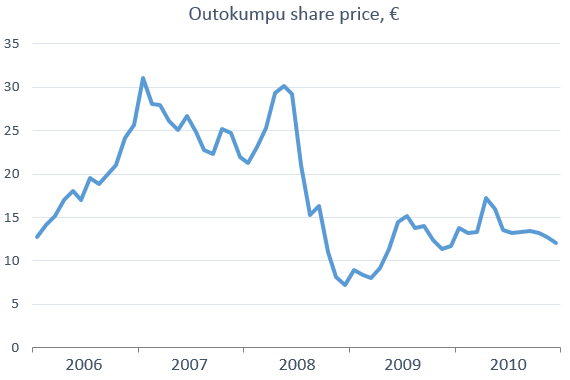
The line graph below shows the changes in the share price of Outokumpu companies in euros between January 2006 and December 2010.
Write a report for a university lecturer describing the information below.


The line graph demonstrates the variation in the share price of Outokumpu companies for the period from January 2006 to December 2010.The figures are given in euros. Overall, it can be seen that share price fluctuated widely throughout the timeframe with some peaks and troughs.
At the beginning of 2006, the share price of these companies stood at around £13. Then it grew gradually over the course of the first year hitting its first peak at just over £30 at the end of 2006, which was the highest figure in the graph. For the period from the beginning of 2007 to the first half of2008, the figure experienced a slight fluctuation before it recorded its second peak of £30.
Nevertheless, the share price of Outokumpu plunged after its second peak hitting a low of around £7 toward the end of 2008. The last two years witnessed a wide fluctuation in the share price between £7 and £17. The share price then finished the period at approximately £12.


Very useful Task writing format and good usage.