

Bar charts are a very common type of question on the IELTS writing task 1 academic paper. Read below for helpful tips and tricks, as well as example questions and a model answer.
Table of Contents
1. Question Overview
An IELTS writing bar chart, also known as a bar graph, is something you may encounter in writing task 1 of the IELTS academic exam. The writing section of the test lasts for 60 minutes in total, and you should dedicate
20 minutes of your time to task 1. Writing task 1 is worth 40% of your overall score for the writing component.
Here is the list of all IELTS Writing Academic Task 1 types
1.1 Objective
The main aim of this task is to produce a minimum of 150-word report that interprets the data presented in a given chart. You need to summarise the main features of the chart, add relevant data/figures and make valid comparisons
where relevant.
1.2 Skills Used
This part of this exam will test your ability to:
- Select and summarise the key features of a chart
- Identify trends in information
- Describe and compare data
- Produce a report using a formal register
2. IELTS Bar Chart Sample Questions
A bar chart presents data visually using rectangular bars. These bars can either occur horizontally or vertically. You may also be given two charts to summarise and contrast in one task. In writing task 1 of the IELTS academic exam,
you will always be given a description of the chart as well as key information you need to understand the chart such as:
- A title and/or statement explaining the chart
- A key/legend that explains the colour coding of the chart
- A labelled vertical Y axis
- A labelled horizontal X axis
2.1 Sample Question 1- Horizontal Bar Chart
You should spend about 20 minutes on this task.
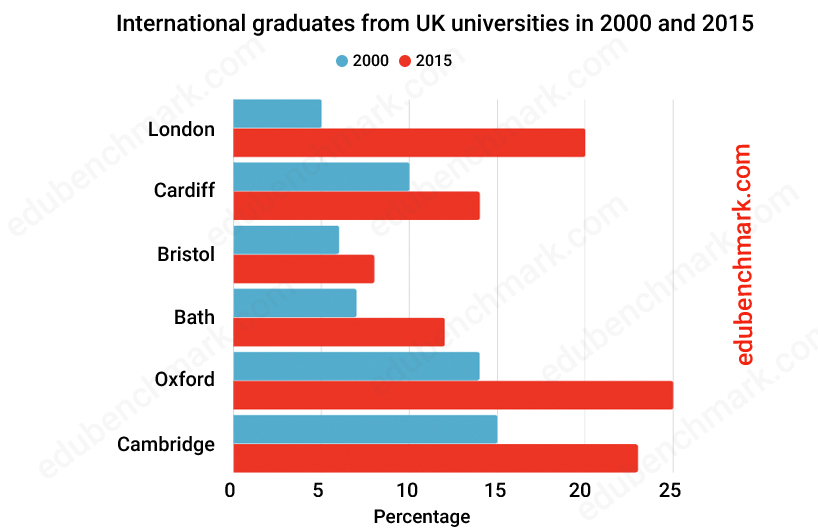
The graph below shows the number of international graduates from UK universities in 2000 and 2015.
Summarise the information by selecting and reporting the main features and make comparisons where relevant.
Write at least 150 words.

2.2 Sample Question 2- Vertical Bar Chart
You should spend about 20 minutes on this task.
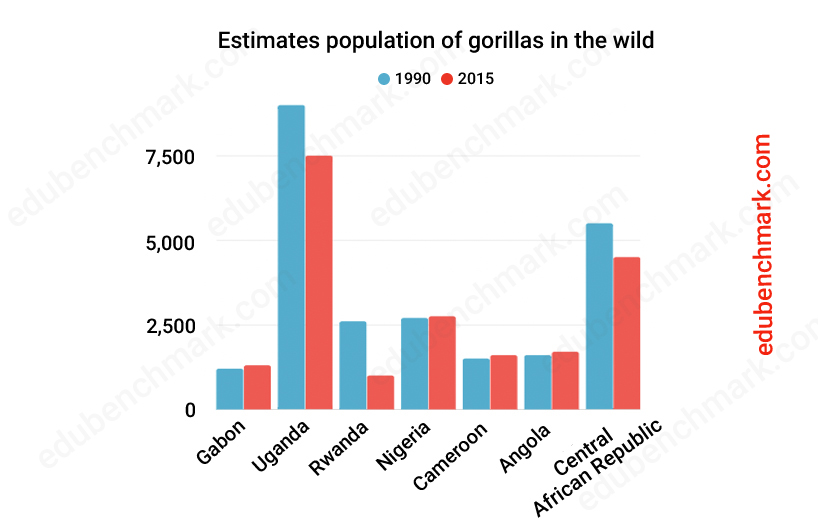
The graph below shows the changes in the maximum number of gorillas in the wild between 1990 and 2015.
Summarise the information by selecting and reporting the main features and make comparisons where relevant.
Write at least 150 words.

2.3 Sample Question 3- Two Bar Charts Presented
You should spend 20 minutes on this task.
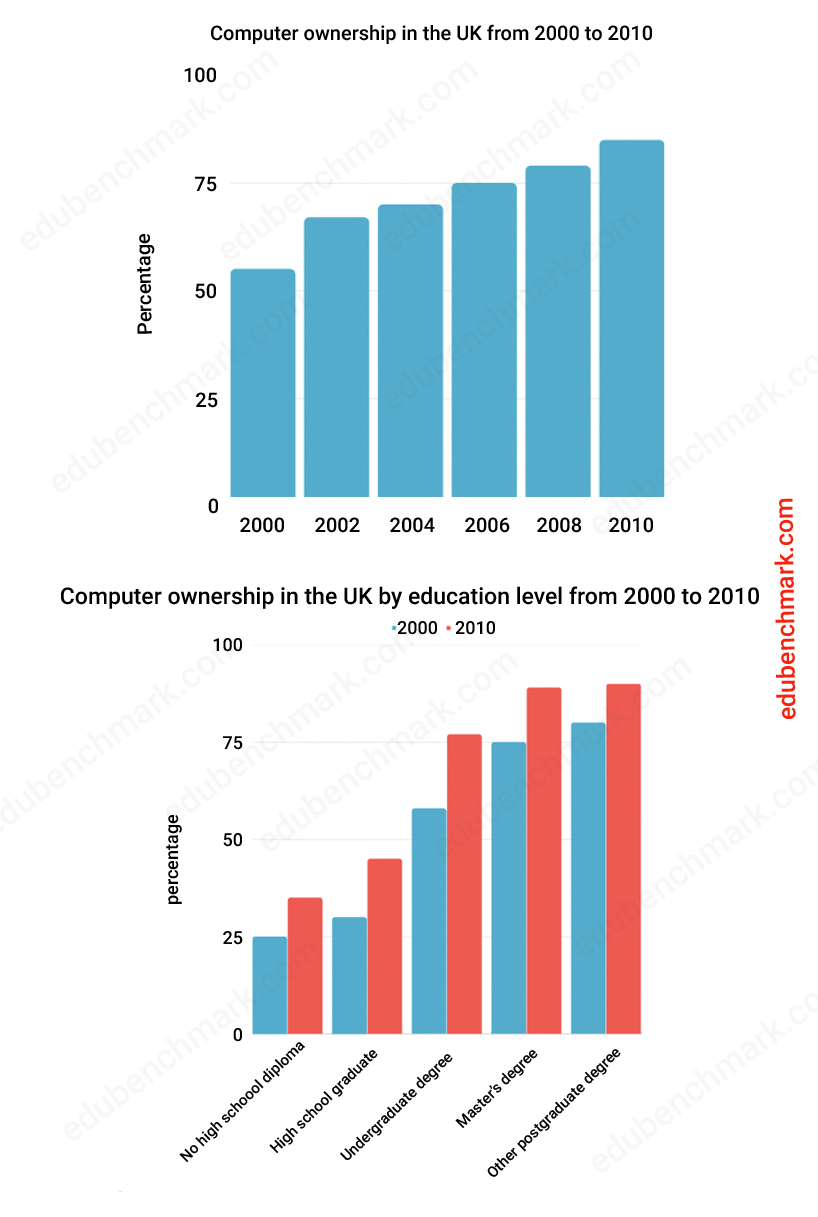
The graphs below give information about computer ownership as a percentage of the population between 2000 and 2010, and by level of education for the years 2000 and 2010.
Summarise the information by selecting and reporting the main features and make comparisons where relevant.
Write at least 150 words.

3. Structure for Bar Chart Reports
A good writing task 1 report will follow a very clear and logical structure with an introduction, an overview, and two main body paragraphs. Even though writing a conclusion is a good idea, it’s acceptable if you do not include a conclusion as the overview paragraph should suffice.
You can follow the same structure each time you practise writing reports. Follow the advice below for each paragraph below to start writing successful reports!
3.1 Introduction
Your introduction should always paraphrase the given statement, meaning you should write it again in your own words. Memorising some good phrases to start a bar graph should help as well, but make sure the phrase you use is relevant to the given IELTS bar graph in the real exam. Let’s have a look at some examples below:
- The bar chart shows / presents
- The bar graph compares
Paraphrasing demonstrates to the examiner that you have fully understood the meaning of the writing task 1 statement and that you have the knowledge and understanding to be flexible with the language. The aim is to change the words and structure of the original statement whilst maintaining the meaning of the text.
Successful paraphrasing may involve some of the following:
- Using synonyms/parallel expressions
- Changing the word order of the sentence
- Changing the phrase from active to passive
- Changing the form of words (e.g., noun to verb)
Example of paraphrasing
Original statement:
The chart shows consumer spending on luxury goods in the UK in 2010 and 2020.
Paraphrased statement:
The chart illustrates the amount of money spent on luxury goods (foreign holidays, high-end vehicles, designer clothes and spa services) by consumers in the United Kingdom in the years 2010 and 2020.
Other things to consider when writing your introduction of a bar chart:
- You do not need to change every word to paraphrase a text successfully
- You may list given categories ( if the list is not too long). Use the word For instance, The bar graph presents wine production data in liters in three countries, namely Australia, New Zealand and Canada.
- Include any dates as this is important for tense
- Use brackets to put data and information inside
- Write 1-2 sentences maximum
- Look at the chart itself to see if there is any additional information to introduce not given in the statement
- This should be your most straightforward paragraph to write. Don’t spend too much time here and move onto your overview and main body paragraphs
3.2 Overview
Your aim in academic writing task 1 is to produce a ‘clear overview’ where you select and describe the main features/ trends from the bar chart. It is very important to include an overview paragraph for your writing task 1 response. The examiner will be looking for this and candidates who do not include an overview paragraph will be extremely difficult to score above a band score 5.0 in task achievement. More on IELTS Writing Band descriptors here.
You do not need to write a conclusion for task 1. A conclusion summarises the main ideas of a text. Your report is too short to do this, and you will end up repeating yourself which is something you want to avoid.
Typically, your overview should come directly after your introduction (recommended). However, you may find some sample reports where the overview comes at the end of the report.
Here are some key things to consider when writing your overview:
- Start your overview with ‘Overall’ to make it easy for the examiner to locate your overview paragraph. Other possible words / phrases are:
- It is clear from the graph that….
- Broadly, it can be seen that..
- There could be 2, 3, 4 or even 5 key features in your chart (we recommend you focus on 2-3)
- Your key features should stand out as the highest or overall figures in some way
- Make sure to use
- You should not give precise figures for your overview, save this for your main body paragraphs
3.3 Main Body Paragraphs
You should have two main body paragraphs in your report to meet coherence and cohesion. Besides, this approach is logical and easy to follow for the reader.
There are different ways you could choose to organise your paragraphs depending on the data. For example:
Main Body Paragraph 1– Compare the highest and lowest categories in the dataset
Main body paragraph 2– Summarise and compare the other categories
The content of your body paragraphs will depend on the chart, but here are some general points to consider:
- Make sure to use the correct tense (look carefully at the given dates, are they in the past, present, future, or perhaps they range from the past to the predicted future)
- Determine if the chart is comparative or
- Always provide data and support your sentences with numbers
- Do not just provide a long list of numbers; the examiner will check every number and they need to be accurate and clear for the reader
- Use symbols given to you on the axis for currency, percentage etc. (e.g., £, $, %)
- Avoid repetition
4. IELTS Writing Task 1 Band Descriptors Explained
4.1 Task Achievement (25%)
To achieve a high band score in task achievement, you must:
- Produce a factual report (use a formal register; do not give your opinion; avoid the first person ‘I’)
- Write at least 150 words (you need to be able to sufficiently develop your ideas)
- Report and compare the key features of the chart (do not try to describe every detail of the chart)
- Provide an overview that clearly highlights the key features of the chart (this is essential to scoring above a band score 5 in task achievement)
- Accurately describe the data
4.2 Coherence and Cohesion (25%)
To achieve a high band score in Coherence and Cohesion of your bar chart task 1, you must:
- Organise your report logically
- Use paragraphs (include an introduction, an overview, and two main body paragraphs)
- Use a range of linking devices accurately and appropriately
- Use referencing effectively to avoid repetition (e.g., using ‘this’ to refer to refer back in your text to a noun/noun phrase)
4.3 Lexical Resource (25%)
To achieve a high band score in Lexical Resource of task 1 bar graph, you must:
- Use a range of vocabulary appropriate to describe data from bar charts
- Show understanding of collocations
- Avoid making spelling mistakes
- Use an appropriate register throughout the report (e.g., avoid slang/ phrasal verbs/ idioms)
4.4 Grammatical Range and Accuracy (25%)
To achieve a high band score in Grammatical Range and Accuracy, you must:
- Use the correct tense according to your data set (confirm if your data is taken from the past, present, future, or a combination, and use the corresponding tense in your report)
- Use a range of simple and complex sentences (e.g., compound, relative, or subordinate sentences)
- Avoid grammatical errors
- Use punctuation accurately
5. Vocabulary for IELTS Bar Charts
5.1 Vocabulary for Accuracy
When describing bar graph IELTS task 1, you will often find that a figure cannot be precisely determined and you have to estimate the number. To show flexibility with your language, you can use words and phrases to estimate the figures. Here is some useful language to help you write about numbers that are above, below or approximate figures:
| Under | Over | About |
|---|---|---|
| Considerably less than | Considerably more than | Approximately |
| Just under | Slightly over | Around |
| Close to | Marginally above | Roughly |
| Slightly under | Well over | Near to |
| Less than | More than | In the region of |
| Almost | Just over | |
| Nearly |
5.2 Linking Devices
In order to create cohesion throughout your report, you should use a range of linking devices appropriately. Here are some useful linkers to create contrast when writing about bar charts:
- whereas
- while
- as opposed to
- compared to
Examples
80% of people owned a computer in 1990, whereas/while only 30% owned one in 1980.
Only 30% of people owned a computer in 1980 as opposed to/compared to 80% in 1990.
5.3 Language for Reference
Using the words ‘respectively’ or ‘in turn’ is an efficient and accurate way to refer back to specific figures in your writing task 1 report. It will also help to avoid unnecessary repetition and
improve your lexical resource score.
When using these terms, the order of the numbers follows the order in the sentence. You can also use brackets to contain the figures.
Examples
The price of oil and gas in 1990 was almost the same (about $100 and $110, respectively).
Espressos were considerably less popular than espressos, at 4 and 8 sales per week in turn.
6. Grammar for Bar Charts IELTS Task 1
6.1 Comparatives
You can use comparative structures to improve your range of grammar and compare the data in the bar chart/s. For example:
You can also use words together with comparative forms to indicate a small or a big difference:
- much
- a lot
- slightly
- a bit
- considerably
Examples:
Americanos were considerably more popular than espressos.
Cappuccinos were slightly more popular than caramel lattes.
6.2 Superlatives
Superlatives are a useful way to rank or order information.
Examples:
- Travelling by plane is the most expensive way to travel, at an average of £100 per ticket.
- The second most expensive is by train, where it costs around £30.
- The least expensive form of transport is by bus, coming in at £20 per ticket.
6.3 Advanced Comparisons
- X is not as + adjective + as y e.g., Coffee in Brazil is not as expensive as in America.
- Not + verb + as + noun phrase + as e.g., Coffee in Brazil does not cost as much as in America, at $2 and $2.90, respectively.
- Three times/ half/ twice as much/less as e.g., Coffee in America costs twice as much as in Brazil.
- The number of X is ___ times higher than Y e.g., The number of people buying coffee in Brazil is three times higher than in America.
7. IELTS Bar Graph Sample Answer
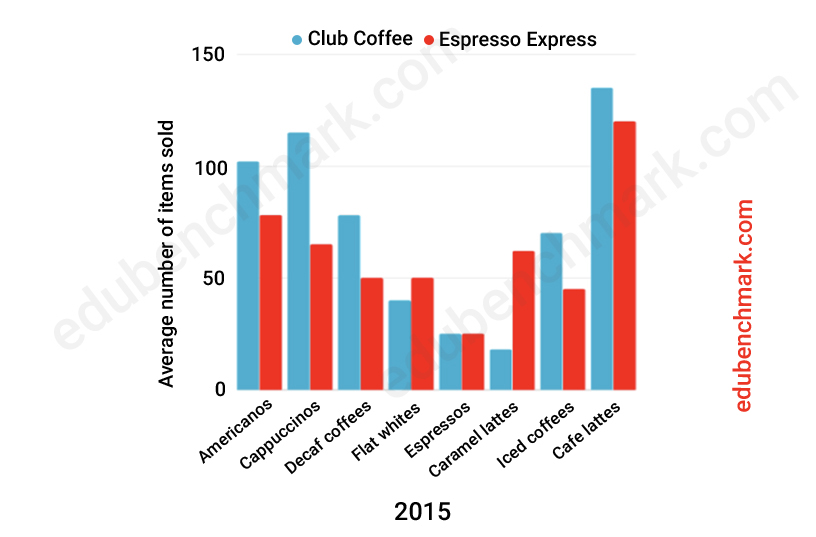
The chart shows data about the average weekly sales of two coffee shops in New York in 2015.
Summarise the information by selecting and reporting the main features and make comparisons where relevant.

Sample
The bar chart compares the most popular types of coffee sold by two coffee shops in New York in a typical week in 2015. The chart shows average sales of eight items, including iced coffees, Americanos and espressos, in Club Coffee and Espresso Express.
Overall, it can be seen that Club Coffee is generally the busiest coffee shop, outselling Espresso Express in six out of eight coffee items. On the whole, stronger coffees such as espressos and flat whites were not as popular as weaker coffees like café lattes or cappuccinos.
In terms of sales at Club Coffee, café lattes came top of the list, with an average of around 135 sold each week. Cappuccinos and Americanos were the next best sellers, with around 115 and 100 of these drinks sold respectively. Club coffee sold slightly more decaf coffees than iced coffees, with roughly 75 of each in total being sold per week on average. Espressos and caramel lattes were not nearly as popular, with just 25 and 18 sold in turn.
Café lattes were also the number-one purchase in Espresso Express, with just over 120 average items sold in a week. Cappuccinos were third, at around 65 sales. Caramel lattes came next, with just over 60, three times as many as are sold in Club Coffee. Decaf coffees and flat whites were joint fifth, with 50 sales apiece, followed by iced coffees at approximately 45 sales a week. The least popular item in Espresso Express was espressos with around 25 sales.
7.1 Model Answer Commentary
The report above would receive an estimated 9.0 overall in the IELTS writing task 1 Academic paper.
It has been organised into four logical paragraphs that are clearly divided into an introduction, overview, and two separate body paragraphs.
The overview paragraph has been clearly signposted using ‘overall’ and a further linker ‘on the whole’. These key features have been compared concisely using phrases such as ‘stronger coffees… were not as popular as weaker
coffees…’.
Further details have been given in the main body paragraphs. The data has been presented accurately using vocabulary to express when the figure cannot be exactly determined, such as ‘around’, ‘just over’ and ‘roughly’.
Comparative language has been used throughout the report through the use of comparatives and superlatives, for example, ‘the least popular item…’
Reference has been employed to reduce repetition, for instance ‘with just 25 and 18 sold in turn’ and ‘with around 115 and 100 of these drinks sold respectively’.
8. Common Errors and How to Avoid Them
8.1 Problem 1
Not understanding what information to include in your bar chart report.
Solution 1
Take a short amount of time, before you even start writing, to identify the key features of the chart. It will be worth investing this time in finding the highest, lowest or most interesting key features instead of wasting time trying to write about every detail
8.2 Problem 2
It is not common that you will be asked to describe a bar chart with a trend, this is more common with a line graph. Candidates often use language to describe trends when it is not appropriate. For example, the sentence ‘the price of X rose from £ ______ to £______ between 2000 and 2010’ is more suitable for a line graph with a trend, not a bar chart.
Solution 2
Ensure you understand the data clearly so you can use the appropriate grammar and vocabulary.
It is likely that a comparative form would be more appropriate instead of describing a change (rise/fall).
Incorrect for bar chart: The price of X rose from £ ______ to £______ between 2000 and 2010.
Correct for bar chart: X cost £____ more than Y, which cost £_____.
9. Quiz- Check Your Understanding
Take this short quiz to test your understanding of writing task 1 and bar charts:


Thank you